|
|
Creating a simple report
The following example shows how to create a simple report
by using the Report Wizard and then modifying it. The example uses
the cfartgallery database, which is installed with ColdFusion.
The example shows how to perform the following tasks:
Create a base report by using the Report Wizard and the
Query Builder.
Use the Expression Builder to modify the data presentation
in the report.
Modify the display text for column data.
Add a text field to the report and format text and data elements
by using report styles.
Add an image file and images from a database.
Create and add a calculated field to display the total sales
by artist.
Add group-level and report-level pie charts that show the
ratio of sold and unsold art for each artist and for all the artists
in the database.
Export report styles to a Cascading Style Sheet (CSS) file.
Create a report by using the Report WizardStart Report Builder.
Select Report Creation Wizard and click OK.
Click the Query Builder button:
Note: If you have RDS
configured, provide the RDS password.
From the
list of data sources in the database pane, expand the cfartgallery database.
Expand the Tables folder.
Double-click the APP.ART table in the database pane. Report
Builder adds the APP.ART table to the table pane.
Double-click the APP.ARTISTS table in the database pane.
Report Builder adds the APP.ARTISTS table to the table pane. Notice
that it automatically creates the join between the two tables based
on the ARTISTID column.
In the APP.ARTISTS table, double-click the FIRSTNAME and
LASTNAME columns. The Query Builder adds the fields to the select
statement in the SQL pane.
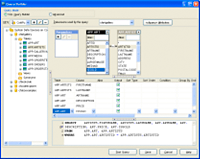
In the ART table, double-click the ARTNAME, DESCRIPTION,
PRICE, and ISSOLD columns. The following example shows the completed
query in the Query Builder:
Click the Test Query button to preview the results.
Close the test query window and click the Save button in
the Query Builder window.
Double-click the FIRSTNAME column to add it to the Non-printed
Fields pop-up menu and click the Next button.
In the Available Fields list, double-click LASTNAME to group
the records by the artists’ last names.
Click the Next button three times to accept the default values.
Choose Silver and click the Next button.
Change the title of the report to Sales Report and click
the Finish button. The Report Creation Wizard generates the report
and displays it in the Report Builder workspace.
Choose File > Save As and save the report as ArtSalesReport1
in the default directory. Report Builder automatically adds the
CFR extension.
Press F12 to preview the report. Report Builder displays
the records grouped by the artists’ last names.
Click the close box to close the Preview Report window and
return to the Report Builder workspace.
Changing the column heading labelsBy default, the Report Wizard uses the column name for
the column headers in the report, but you can change the label text
for column headings.
Edit the heading label textDouble-click the LASTNAME field in the Column Header
band.
Replace the column name with Artist Name, and click OK.
Replace the remaining column labels as follows:
Using expressions to format dataUse the Expression Builder to perform the following tasks:
Change the display of the ISSOLD value to a yes/no expression.
By default, Report Builder displays 0 (not sold) or 1 (sold) for
the ISSOLD column based on how the data is stored in the database.
You can use a function to change the display to yes or no.
Change the value of the PRICE column to a dollar format.
Concatenate the artists’ first and last names. Even though
the FirstName field is a nonprinted field in the report, you can
add it to an expression because it is part of the SQL query that
you created.
Change a Boolean value to yes/noDouble-click the query.ISSOLD element in the detail
band. Report Builder displays the Expression Builder for that element.
In the Expression Builder, expand the Functions folder.
Choose Display and Formatting from the Functions list. Report
Builder displays the list of functions in the right pane of the
Expression Builder.
Double-click YesNoFormat from the list of functions. Report
Builder automatically completes the following expression in the
expression pane:
YesNoFormat(query.ISSOLD)
Click OK to close the Expression Builder and return to the
report.
Choose File > Save to save your changes to the report.
Press F12 to preview the report. Yes or no appears in the
Sold? column based on whether the artwork sold.
Display numbers in dollar formatDouble-click the field in the PRICE column of the
detail band.
In the expression pane, change the expression to the following
text:
DollarFormat(query.PRICE)
Click OK to close the Expression Builder and return to the
report.
Concatenate the FIRSTNAME and LASTNAME fieldsDouble-click the query.LASTNAME field in the LASTNAME
group header.
In the Expression Builder, type the following expression:
query.FIRSTNAME &" "& query.LASTNAME
Notice
that the Expression Builder prompts you with the available field
names as you type.
Click the OK button in the Expression Builder.
Choose File > Save from the Report Builder menu bar to
save your changes to the report.
Press F12 to preview the report.
Report Builder displays
the first and last name for each of the artists. Notice that the
report still is grouped alphabetically by last name.
Close the preview window.
Adding page breaks before group changesCreate a page break so that each artist name starts on
at the top of a page in the report output.
Add page breaks between artist namesChoose Report > Group Management from the main
menu bar. The Group Management dialog box appears with LASTNAME
selected.
Click the Edit button.
Select the Start New Page option and click OK.
Adding a calculated fieldCalculate the sum of the artwork sold by artistChoose Window > Fields and Parameters.
Report Builder displays the Fields and Parameters panel.
Expand the list of calculated fields.
With Calculated Fields selected, click the (+) button at
the upper edge of the Fields and Parameters panel.
Make the following changes in the Add Calculated Field dialog
box:
Change the name of the calculated field to Sold.
Change the label text to Sold.
Change the Data Type to Float.
Change the Calculation to Sum.
In the Perform Calculation On field, enter the following
expression:
Iif(IsBoolean(query.ISSOLD) and query.ISSOLD, query.Price,0)
This
expression multiplies the total price of the artwork per artist
by the number of items sold to calculate the total sales per artist.
If the ISSOLD value for a record is 1 (sold), the value is multiplied
by 1 and added to the total; if the ISSOLD value for a record is
0 (unsold), the value is multiplied by 0.
Change the Reset Field When value to Group.
Change the Reset Group value to LASTNAME, and click
OK. Report Builder adds the calculated field definition in the Fields
and Parameters panel.
Add the calculated field to your reportInsert a field in the LASTNAME Footer band.
In the Add Field dialog box, select calc.Sold from the pop-up
menu.
In the Expression Builder, type the following code:
DollarFormat(calc.Sold)
Press F12 to preview the report. Report Builder displays
the sum of the artwork sold for each artist.
Adding and formatting fieldsYou can add a text field to your report and define a style
for it. When you define a style, you can reuse it throughout your
report or export the style so that you can use it in other reports.
Also, you can override report styles at run time by using the cfreport and
the cfreportparam tags. For more information, see Overriding report styles.
Add a text fieldIn the Controls toolbox on the left side of the
Report Builder window, click the text icon (the button with abc
on it) and place the text field to the left of the calculated field
in the LASTNAME footer.
In the Edit Label dialog box, type Total Sales, and
click OK.
Create a styleChoose Window > Report Styles from the main
menu.
Click the (+) button.
In the Name field, enter GroupFooter.
Click the Color and Style tab and change the color to #9999CC.
Click the Font tab and change the Font to Tahoma and
click the bold option. Then click OK. Report Builder adds GroupFooter
style to the pop-up menu of available styles in the report.
Choose File > Save from the menu bar to save your changes
to the report.
Apply the style to text and data elements in the reportSelect the Total Sales text box in the LASTNAME
Footer band.
Choose Window > Properties Inspector.
Choose GroupFooter from the Style pop-up menu.
Select the calculated field element and apply the GroupFooter
Style to it.
Press F12 to preview your report:
Adding imagesWhen you add images with Report Builder, you can perform
the following types of tasks:
Replace the company name text box with a company logo
in the report header.
Use the Query Builder to add images from a database.
Display the report in RTF format for faster display.
Add a logo to the report headerSelect the Company Name text box located in the
header band preceding Sales Report.
Choose Edit > Cut to remove the text box from the report.
Click the Add Image icon in the Controls toolbox. (The icon
has a picture of a tree on it.)
Drag the mouse in the header band preceding the Sales Report
text box. When you release the mouse, the Image File Name dialog
box appears.
Navigate to the Art World logo file:
C:\ColdFusion9\wwwroot\cfdocs\getting_started\photos\somewhere.jpg
Click Open. Report Builder displays the Art World logo in
the area that you selected.
With the image selected in the workspace, choose Windows
> Properties Inspector. The Properties Inspector for the image
appears:
Under Colors and Style, change the Transparency
to Transparent.
Under Formatting, change Scale Image to Retain Shape.
In the Header band, control-click the logo image and the
Sales Report text box in the workspace to select them.
Click the Align Left Sides icon in the Controls toolbox.
Choose File > Save to save your changes.
Press F12 to preview the report.
Close the preview window and readjust the image size and
location as needed.
Add images from a databaseFrom the menu bar, choose Report > Report Query.
In the Art table, double-click LARGEIMAGE. The Query Builder
adds the LARGEIMAGE column to the select statement.
Click the Test Query button. A list of image filenames appears
to the right of the ISSOLD column.
Close the Test Query window and click the Save button in
the Query Builder.
In the Report window, expand the Detail band by clicking
the lower splitter bar and dragging down.
Click the Add Image icon in the Controls toolbox and drag
the mouse in Detail band of the report to the left of the query.ARTNAME
field. When you release the mouse, the Image File Name dialog box
appears.
Navigate to the cfartgallery images directory:
C:\ColdFusion9\wwwroot\cfdocs\images\artgallery
In the File Name field, type #query.largeimage#.
Click the Open button. Report Builder adds the column to
the Detail band of the report.
Align the image column with the top of the Detail band.
With the image element selected in the detail band, choose
Window > Properties Inspector.
Change the following properties:
Transparency:
Transparent.
Scale Image: Retain Shape. This option scales the images
proportionately within the bounding box.
Error Control: No Image. This option ensures that Report
Builder displays blank images rather than generates an error for
images missing from the database.
Using Cache: False. This option refreshes the display each
time you preview the report output in the browser.
Choose File > Save to save your changes.
Change the report output formatChoose Report > Report Properties from the menu
bar.
From the Default Output Format pop-up menu, choose RTF. Use
this format for faster display in a web browser.
Click OK to close the Report Properties dialog box and return
to the report.
Choose File > Save to save your changes.
Press F12 to preview the report. The images are displayed
beneath Artist name and to the left of the art title.
Change the Default Output Format to HTML and preview the
results.
Adding chartsYou can use the Chart Builder to add two pie charts to
your report: the first pie chart shows the total dollar amount of
the art sold versus the total dollar amount unsold art for each
artist; the second pie chart shows the sum of artwork sold versus
unsold for all of the artists.
The two pie charts are the same except for the scope. To apply
a pie chart to a group (the ratio of sold to unsold art for each
artist), add the pie chart to the group footer band. To apply the
pie chart to the report (the ratio of sold to unsold art for all
artists), add the pie chart to the report footer band.
In Adding a calculated field, you added a calculated field for the
total dollar amount of artwork sold. Before you can create the pie
chart for this example, create a second calculated field for the
total dollar amount of unsold art.
Add a calculated field for the sum of unsold artChoose Window > Fields and Parameters.
Select the Calculated Fields heading in the Fields and Parameters
panel.
Click the (+) icon at the upper edge of the panel:
In the Name field, type Unsold.
In the Default Label Text field, type Unsold.
In the Data Type field, choose Big Decimal from the pop-up
menu.
In the Calculation field, choose Sum from the pop-up menu.
In the Perform Calculation On field, enter the following
expression to calculate the dollar amount of unsold art:
Iif(IsBoolean(query.ISSOLD) and not(query.ISSOLD), query.Price,0)
In the Reset Field When field, choose Group from the pop-up
menu.
In the Reset Group field, choose LASTNAME.
Click OK to close the Add Calculated Field dialog box and
return to the report.
Choose File > Save from the menu bar to save your changes
to the report.
Add a pie chart to the group footerExpand the LASTNAME Footer band.
Choose Insert > Chart from the Report Builder menu bar:
Choose Pie from the Base Chart Type list. The Chart Sub-Type
appears to the right of the Base Chart Type.
Choose the 3D chart.
Click the Next button. Then click the Add button:
In the Series Label field, type Total Sales.
In the Paint Style field, choose Light.
In the Data Label field, choose Value.
In the Color List, type Teal,Gray.
In the Chart Data Source area, ensure that the Data From
A Fixed List of Values option is selected.
Click the Add button:
In the Label field, type Sold.
In the Value field, choose #calc.Sold# from pop-up menu.
Click OK.
Click the Add button again:
In the Label field,
type Unsold.
In the Value field, choose #calc.Unsold# from the pop-up
menu.
Click OK twice to return to the Chart Series dialog box.
Click the Next button. In the Chart Formatting dialog box,
click the Titles & Series tab and make the following changes:
In the Chart Title field, type Total Sales for #query.LASTNAME#.
In the X Axis Title field, type Sold.
In the Y Axis Title field, type Unsold.
In the Label Format field, choose Currency from the pop-up
menu.
Click the 3-D Appearance tab and ensure that Show 3-D is
selected.
Click the Font tab and make the following changes:
Change the Font Name to Arial.
Change the Font Size to 9.
Click the Finish button. Report Builder adds a place holder
for the pie chart in the report.
Resize and move the chart to the desired location within
the LASTNAME Footer band.
Choose File > Save to save your changes to the report.
Press F12 to preview the report.
Add a pie chart to the report footerCreate two calculated fields to use in the report
footer pie chart with the following parameters:
Name
|
TotalSold
|
TotalUnsold
|
|---|
Default Label Text:
|
Total Sold
|
Total Unsold
|
Data Type:
|
Big Decimal
|
Big Decimal
|
Calculation:
|
Sum
|
Sum
|
Perform Calculation On:
|
Iif(IsBoolean(query.ISSOLD) and query.ISSOLD, query.Price,0)
|
Iif(IsBoolean(query.ISSOLD) and not(query.ISSOLD), query.Price,0)
|
Initial Value:
|
0
|
0
|
Reset Field When:
|
Report (Changes)
|
Report (Changes)
|
Reset Group:
|
LASTNAME
|
LASTNAME
|
Expand the Report Footer band, which is located directly
below the Page Footer band.
Copy the pie chart from the Group Footer and paste it in
the Report Footer.
Double-click the pie chart and click the Next button.
Double-click Total Sales to display the Edit Chart Series
dialog box.
Change the Series Label to Total Sales for Artists.
Change the chart series values:
Label
|
Value
|
|---|
Sold
|
#calc.TotalSold#
|
Unsold
|
#calc.TotalUnsold#
|
Click the Next button, and then Click the Title & Series
tab.
Change the Chart Title to Total Sales for Artists,
and click Finish.
Choose File > Save from the menu bar to save your changes
to the report.
Press F12 to preview the report.
The Total Sales for Artists pie chart appears only on the last
page of the report. Verify that the calculations are correct.
Using Cascading Style SheetsThe Report Creation Wizard automatically creates and applies
the following styles to your report:
The instructions on Adding and formatting fields show how to add a field called GroupFooter
and apply it to a text field and a data field in the GroupFooter
band. You can export the styles in a report to a CSS file. Report
Builder automatically generates the CSS code for the styles. This
technique is an efficient way to maintain a single set of styles
to use with multiple reports. You can modify the styles in the CSS
file by using any text editor and either import the CSS file in Report
Builder or override the styles in the report at run time.
Export report styles to a CSS fileChoose Window > Report Styles.
Click the export icon (the icon with the orange arrow).
In the File Name field, type artstyles. Report Builder
automatically adds the CSS extension.
Navigate the artStyles.css file and double-click it to open
it. The following example shows the generated CSS code:
ReportTitle
{
        color:Black;
        font-size:24pt;
}
CompanyName
{
        color:#6188A5;
        font-weight:bold;
}
PageTitle
{
        color:#333333;
        font-size:14pt;
        font-weight:bold;
}
ReportDate
{
        color:#333333
}
SubTitle
{
        color:#6089A5;
        font-size:12pt;
        font-weight:bold;
}
DetailLabel
{
        color:Black;
        background-color:#E3EDEF;
        font-weight:bold;
}
DetailData
{
        default-style:true;
        color:Black;
        line-size:thin;
}
PageFooter
{
        color:#2F2F2F;
        font-size:8pt;
}
RectangleStyle
{
        color:#E3EDEF;
        background-color:#E3EDEF;
}
LineStyle
{
        color:#CCCCCC;
        background-color:#CCCCCC;
}
GroupFooter
{
        color:Blue;
        font-weight:bold;
        font-family:Tahoma;
Change the ReportTitle style color attribute
to Red and add the font-weight attribute,
as the following code shows:
ReportTitle
{
        color:Red;
        font-size:24pt;
        font-weight: bold;
}
Save the CSS file.
Also, you can override report styles from ColdFusion. Form more
information, see Overriding report styles.
Note: If you add a style to the CSS file, add a style
with the same name to the report in Report Builder. Also, Report
Builder does not support all CSS styles. For more information, see
the cfreport tag in the CFML Reference.
Import the CSS fileChoose Window > Report Styles.
Click the import styles icon (the one with the blue arrow).
Navigate to the location of the artStyles.css file, and click
OK. Report Builder automatically updates the report style definition
and applies the updated style to report title.
Press F12 to preview the report.
Overriding report settings at run timeYou can use the cfreport tag in ColdFusion
to override report settings in a Report Builder report at run time.
The examples use the CFR file that you created in Creating a simple report.
Overriding the report queryThis example filters the data in the report based on the
login ID of the artist. When the artist logs on, the report displays
the data and pie chart for that artist. The report also includes
the pie chart with data from all the artists.
The following code creates a simple login page in ColdFusion.
The form uses artist’s last name as the user ID. (The code does
not include password verification):
<h3>Artist Login Form</h3>
<p>Please enter your last name and password.</p>
<cfform name="loginform" action="artSalesReport.cfm" method="post">
<table>
    <tr>
        <td>Last Name:</td>
        <td><cfinput type="text" name="username" required="yes" message="A username is
            required."></td>
    </tr>
    <tr>
        <td>Password:</td>
        <td><cfinput type="password" name="password" required="yes" message="A password is
            required."></td>
    </tr>
</table>
    <br />
    <cfinput type="submit" name="submit" value="Submit">
</cfform>
On the processing page, add a query like the one you created
in the Report Builder report. The ColdFusion query must contain
at least all of the columns included in the Report Builder query;
however, the ColdFusion query can contain additional data.
The query in the following example selects all of the data from
the ART and ARTISTS tables based on the artist’s last name. The cfreport tag
uses the pathname of the CFR file as the report template.
<cfquery name="artsales" datasource="cfartgallery">
SELECT *
FROMAPP.ART, APP.ARTISTS
WHERE APP.ART.ARTISTID = APP.ARTISTS.ARTISTID
         AND APP.ARTISTS.LASTNAME= <cfqueryparam value="#FORM.username#">
ORDER BY ARTISTS.LASTNAME
</cfquery>

<cfreport query="#artsales#" template="ArtSalesReport1.cfr" format="RTF"/>
ColdFusion displays the report for the artist in RTF format.
Notice that the value of the format attribute overrides
the Default Output format defined in the CFR file.
Exporting the report in HTMLTo generate a report in HTML and display it directly in
the browser, change the format attribute to HTML:
<cfreport template="ArtSalesReport1.cfr" format="HTML"/>
ColdFusion automatically generates a temporary directory where
it stores all of the image files in the report (charts are saved
as PNG files). The location of the temporary directory is:
C:\ColdFusion9\tmpCache\CFFileServlet\_cfreport\_report[unique_identifier]
You can specify when the temporary directory is removed from
the server by using the CreateTimeSpan function
as a value for the resourceTimespan attribute:
<cfreport query="#artsales#" template="ArtSalesReport1.cfr" format="HTML" resourceTimespan="#CreateTimeSpan(0,1,0,0)#"/>
You can specify the time span in days, hours, minutes, and seconds.
In this example, the temporary directory is deleted after one hour.
For more information, see the CFML Reference.
To export the report output to an HTML file, specify the filename attribute.
The following code writes the report output to an HTML file called
artSales.html:
<cfreport template="ArtSalesReport1.cfr" format="HTML" filename="artSales.html" overwrite="yes"/>
ColdFusion creates an image directory relative to the HTML output
file in the format filename_files. In this example, ColdFusion
automatically generates PNG files for the charts in the report and
saves them to a directory called artSales_files. Also, it generates
copies of all of the JPG images extracted from the cfartgallery database
and stores them in the artSales_files directory. For more information, see
the CFML Reference.
Overriding report stylesTo override the report styles in a report, specify the style attribute
of the cfreport tag. The value must contain valid
CSS syntax, the pathname to a CSS file, or a variable that points
to valid CSS code. The CSS style names must match the report style
names defined in Report Builder.
The following code shows how to override the styles in the ArtSalesReport1.cfr report
with the styles defined in the artStyles.css file:
<cfreport template="ArtSalesReport1.cfr" style="artStyles.css" format="PDF"/>
The following code shows how to apply a CSS style as a value
of the style attribute:
<cfreport template="ArtSalesReport1.cfr" style='ReportTitle {defaultStyle: false;
    font-family:"Tahoma"; color: "lime";}' format="FlashPaper">
</cfreport>
The following code shows how to create a variable called myStyle and
use it as a value of the style attribute:
<cfset mystyle='DetailData { defaultStyle: true; font-family: "Tahoma"; color: ##00FFF0;}'>
<cfreport template="ArtSalesReport1.cfr" style="#mystyle#" format="HTML">
</cfreport>
For more information, see the cfreport tag in the CFML Reference.
|