|
|
Common reporting tasks and techniques
With
Report Builder, you can include data in reports in a variety of
formats, and perform calculations on the information. For more information,
including troubleshooting tips, see Report Builder online Help.
Grouping and group breaksYou can add clarity to a report’s
organization by grouping the information. You can define separate
headings for each new group and also display group-specific summary
information, such as subtotals at the end of each group’s area of
the report. For example, you could create a report that displays
departments, employees, and their salaries. Grouping the data by
department lets users quickly understand department salary characteristics.
When the department ID changes, the ColdFusion Report Builder triggers
a group break. The group break completes the old group by displaying
the group footer and starts the new group by displaying the group
header.
The ColdFusion Report Builder does not group data itself. Ensure
that the SQL used to retrieve the result set is already grouped
in the appropriate order; typically you implement grouping by specifying
an ORDER BY clause in the SQL SELECT statement used for the report.
For example, you could use the following SQL SELECT statement:
SELECT EmployeeID, LastName, FirstName, Title, City, Region, Country
FROM Employees
ORDER BY Country, City
For this example, you can define two groups: one that corresponds
to Country, and a second group that corresponds to City. When you
define more than one group, the Group Management dialog box appears
with Up Arrow and Down Arrow keys, which you can use to control
group hierarchy. For example, country should precede city, because
countries contain cities.
Define a groupSelect Report > Group Management from the menu
bar.
Click Add.
Specify a group name in the Name field.
Specify the value that controls grouping (also called a group
expression) in the Group on field. At run time, ColdFusion triggers
a group break when the result of this value changes. These values
are often query field names. However, this value can also be a calculated
field or other type of expression. Sample group expressions include
the following:
- Query field
- Creates a group break when the associated column in the result set
contains a different value. The field that you specify must be one
of the sort criteria for the result set; for example, query.country.
- Calculated field
- Creates a group break when a calculated field returns a different
value. For example, if the expression calc.FirstLetter returns the
first letter of a query column, you can group a report in alphabetical
order.
- Boolean expression
- Creates a group break when a Boolean expression returns a
different value. For example, if your result set is sorted by the passpercentage
column, you could use the Boolean expression query.passpercentage
LT 50.
Specify group break options:
- Start New
Column
- Forces a new column on a group break.
- Start New Page
- Forces a new page on a group break.
- Reset Page Number
- Resets the page number to 1 on a group break.
Specify band size and printing information:
- Min. height for group
- The minimum height that must remain on a page for ColdFusion
to print the group band on that page.
- Reprint Header on Each Page
- Displays the group header on each page.
Click OK.
The Report Builder adds the group to the
report and creates header and footer bands for the group.
Click OK again.
Add headings, text, query fields, calculated fields, and
other information to the group’s header and footer.
Create group subtotalsCreate a calculated field to contain the group
subtotal. Create the calculated field that uses the following criteria:
Specify a numeric data type.
Select Sum in the Calculation field.
Specify the field to sum on in the Perform Calculation On
field. For example, a report on employees by department could sum
on query.emp_salary.
Specify to reset the field when the group changes.
Place the calculated field on the report.
For more information on calculated fields, see the Report Builder
online Help.
Defining, modifying, and using fields and input parametersThe
Report Builder supports variable data through query fields, input
parameters, and calculated fields, as follows:
- Query field
- Maps to columns in the database result set associated with
the report. You define one query field for each column in the associated
database query.
- Calculated field
- Analyzes or sums multiple
detail rows in a report. ColdFusion dynamically generates calculated
field values at report-generation time, optionally recalculating
the value with each new report, page, column, or group.
- Input parameter
- Specifies data fields that you pass to the report at run
time through the cfreportparam tag or from a main
report to a subreport. You can place input parameters directly on
a report band or you can use them as input to a calculated field.
Define a query fieldChoose Window > Fields and Parameters.
Click Query Fields.
Click the plus sign (+) at the upper edge of the tab.
Type a value for the name field. This value must match a
column name in the corresponding cfquery statement and cannot contain
a period.
Type a default label.
Specify the data type of the corresponding database column,
as follows:
Object
|
Time
|
Long
|
Boolean
|
Double
|
Short
|
Byte
|
Float
|
Big Decimal
|
Date
|
Integer
|
String
|
Time Stamp
|
BLOB
|
CLOB
|
Click OK.
Note: The Query Builder defines query fields automatically
for all database columns in the result set (this action does not
apply to the Advanced Query Builder). Also, if you run the Query
Builder as part of the Report Creation Wizard, the wizard places
query fields on the report.
Define a calculated fieldChoose
Window > Fields and Parameters.
Click Calculated Fields.
Click the plus sign (+) at the upper edge of the tab.
Specify a name, default label text, and data type. Data type
options are the same as for query fields.
Specify calculation options:
- Calculation
- Specifies the type of calculation that ColdFusion performs.
Valid values are: Average, Count, DistinctCount, First, Highest,
Lowest, Nothing, Standard Deviation, Sum, System, and Variance.
If you specify Nothing, you typically use the Perform Calculation
On field to specify a dynamic expression. Except for Nothing (for
which you use the Perform Calculation On field) and System (for
which you write a customized scriptlet class), you use these calculations
for group, page, and report totals.
- Perform Calculation On
- Specifies a field or expression. Click the ... button to display
the Expression Builder.
- Initial Value
- Specifies
an initial value for the calculated field.
Specify the following reset options, and click OK:
- Reset Field When
- Specifies when to reset the calculated field value. Valid values
are: None, Report, Page, Column Group.
- Reset Group
- If Reset Field When is set to Group, use this field to specify
the group whose group break triggers the reset.
For additional
information on calculated fields, see the Report Builder online Help.
Define an input parameterChoose
Window > Fields and Parameters.
In the Fields and Parameters panel, click Input Parameters.
Click the plus sign (+) at the upper edge of the tab.
In the Add Input Parameter dialog box, enter a value for
the name field. This value must match an input parameter, such as
the name attribute of a cfreportparam tag included
in the cfreport tag that uses the report definition.
Enter the default label text.
Specify a data type and default value, and click OK. Data
type options are the same as for query fields.
For more information on using input parameters, see Using input parameters to pass variables and other data at run time and Using subreports.
Place a query field, calculated field, or input parameter on a report bandIn
the Fields and Parameters panel, use the radio buttons to specify
whether to place the label, the field, or both.
Drag the query field, calculated field, or input parameter
from the Fields and Parameters tab to the appropriate report band.
Drag the query field, calculated field, or input parameter
to the desired band.
(Optional) Use the Properties panel to customize the field
display.
For example, you could have a query field named query.emp_salary
and a calculated field that sums query.emp_salary, resetting it
with each group. Place query.emp_salary in the detail band, and
the associated calculated field in the group footer band.
Using toolbox elements on report bandsYou
use the toolbox to add graphic and textual elements, such as images,
circles, squares, lines, dynamic fields, charts, and subreports,
to report bands.
The basic technique for adding toolbox elements is to click in
the toolbox element and then drag to define an area in the appropriate
report band. For some toolbox elements, such as image and text box,
a dialog box immediately appears, prompting for more information.
For all toolbox elements, you customize the appearance of the element
by using the Properties sheet.
 You can add toolbox elements from the Insert
menu. For information on charts, see Using charts. For information on subreports, see Using subreports.
Create a text boxClick
the Label icon (abc) in the toolbox.
Define the area for the label by dragging on the desired
band.
Enter the label text in the Edit Label Text dialog box. To
add a line break, press Control+Enter.
Click OK, or press Enter.
Note: ColdFusion trims leading and trailing blanks
from labels. To include leading and trailing blanks, define a dynamic
field and include the blanks in the expression, for example, " My
Title ".
Import image filesClick
the Image icon in the toolbox.
Define the area for the image by dragging on the desired
band.
In the Image File Name dialog box, navigate to the file that
contains the image, select the file, and click OK.
Use a database BLOB column as an image sourceClick the image icon in the toolbox (the icon has
a tree on it).
Define the area for the image by dragging on the desired
band.
The Image File Name dialog box appears.
You can also drag the BLOB field from the Fields
and Parameters tab to a report band. Click Cancel.
The Expression Builder appears.
Click the Image Type pop-up menu and change File/URL to BLOB.
Select the query field or input parameter that contains the
BLOB column.
Note: The BLOB column must contain
a binary image in GIF, JPEG, or PNG format.
Click OK.
Note: These instructions assume that the contents
of the BLOB column can be rendered as an image.
Add rectangles, ellipses, and linesClick the rectangle, ellipses, or line icon in
the toolbox.
Define the area or line by dragging on the desired band.
Resize the selected element by dragging the handles that
surround it.
Pressing the Control key while resizing a rectangle,
ellipsis, or line, constrains the element to a square, circle, or
angles that are multiples of 45 degrees. Add dynamic fieldsClick the Field icon in the toolbox.
Define the area for the dynamic field by dragging on the
desired band.
The Add Field dialog box appears (if you haven’t
defined any query fields, the Expression Builder appears).
Select the field to add. Selecting a query field, calculated
field, or input parameter is the same as dragging from the Fields
and Parameters tab.
(Optional) Select Manually Entered Expression.
The
Expression Builder appears. This option is useful for calculations
that use variables in the same row. For example, to compute total
price for an order detail line item, you could use the following
expression:
LSNumberFormat((query.unitprice * query.quantity), ",_.__")
Click OK.
Aligning elementsOrganized
element layout is essential to a visually pleasing report. You achieve this
organization by aligning, spacing, and centering visual elements
on each band relative to each other, to the band itself, and to
elements on other bands.
The Report Builder Align Palette includes the following options:
Align left, center, and right
Align top, horizontal, and bottom
Same heights, widths, and both
Space equally horizontally
Space equally vertically
You align, size, and space multiple report elements, as follows:
Relative to the band they are in: You control relative
alignment through the Align to Band icon, which is the bottom icon
in the Align Palette. When it is enabled, the Align to Band icon
has a rectangle surrounding it, and the Report Builder aligns and
spaces one or more elements relative to the height and width of
the band.
Relative to each other: When Align to Band is disabled,
Report Builder aligns and spaces two or more elements relative to
each other.
Use the Align PaletteSelect two or more elements by pressing Control-click,
Shift-click, or using lasso select.
Click the alignment icon, or select Modify > Alignment
> alignment option from the menu bar.
The Align Palette options are also available
from Modify > Alignment on the menu bar. For complete information on fine-tuning element display, see
the Report Builder online Help.
Using report stylesA report style is like a font style
in Microsoft Word. Instead of explicitly associating an element
with formatting specifications, you associate the element with a
style. doing so provides you with report-wide control of the formatting
characteristics of your report.
Additionally, you can specify style that is the default for the
report. The ColdFusion Report Builder uses the default style for
all fields for which you have applied no other font specifications
or styles. The default style, if defined, is displayed in bold in
the Report Styles panel.
Report Builder also lets you import styles from a Cascading Style
Sheet (CSS) file and export styles defined in Report Builder to
a CSS file. This way you can enforce standard formatting across
reports and override styles at run time from a CFM page. For more
information, see Using Cascading Style Sheets and the CFML Reference.
Note: When choosing fonts for your report, ensure
that the fonts are available on the server that runs ColdFusion
and (if you don’t embed fonts) on the client computer. For more
information on fonts, see Creating a simple report.
Define a styleChoose Window > Report Styles.
Click the (+) icon at the upper edge of the Report Styles
tab.
Type a value for the Name field. Style names must be unique.
Add other style characteristics, and click OK.
Specify a style as the defaultEdit a text style or create one.
Select the option with this label: This option is the default
style if no other style is selected for an object.
Add or modify other text style characteristics, and click
OK.
Apply a style to a report elementSelect the element in the report band.
Choose Window > Properties Inspector.
Choose the style from the Style pop-up menu.
For more information, see the Report Builder online Help.
Previewing reportsReport building is an iterative process
and most developers periodically display the in-progress report
to review their most recent changes. If your report uses an internal
query and you established default web root settings, preview functionality
is enabled automatically. If your report uses a passed query, define
an associated CFM page and associate that page with the report.
The Report Builder runs this page when you request Report Preview.
Preview a report that uses an internal query(Optional) Define default server connection information
using the Preferences dialog box, if you did not define these settings
previously:
Default RDS server configuration (used
for Query Builder and Chart Wizard only; not required for report
preview).
Fully qualified path for the local web root directory; for
example, C:\ColdFusion\wwwroot or C:\Inetpub\wwwroot.
URL for the local web root, for example, http://localhost:8500
or http://localhost.
(Optional) Specify the output format in the Report Properties
dialog box (the default format is FlashPaper).
(Optional) If a CFM page runs, specify the URL of the CFM
page in the Report Properties dialog box.
Save your report.
Select File > Preview from the menu bar to display the
report.
Note: If the Report Builder displays the
Edit Preview Report URL dialog box instead of displaying the Preview
window, select Edit > Preferences from the menu bar and insure
that the web root file and URL settings are correct on the Server
Connection pane.
Close the preview window by pressing F12.
If your report is designed to accept a query object from a cfreport tag, associate
a URL with the report. If necessary, the Report Builder prompts
for this URL when you preview the report. Otherwise, you can open
the Report Properties dialog box, and specify the URL of the CFM
page in the Report Preview URL field.
You can use the cfreport tag to run a report, regardless of whether the report has an internal query or is passed a query.Preview with an associated CFM fileSelect Report > Report Properties from the menu
bar.
Specify the URL of the associated CFM page in the Report
Preview URL field. This CFM page must contain a cfreport tag
whose template attribute specifies the current
CFR file and, if necessary, passes a query in the query attribute.
Save your report.
Press F12. Depending on the output format that you have chosen,
the Preview Report window displays your report in PDF, FlashPaper,
RTF, XML, HTML, or Excel format.
Displaying page numbersThe Report Builder includes
a built-in calculated field named PAGE_NUMBER, which
displays the current page number when you place it on a report band.
Add a built-in calculated fieldClick the Field tool in the toolbox.
Drag in the center of the header or footer band to define
the size of the page number field.
The Add Field dialog box
appears, listing all fields defined for the report, including built-in
calculated fields and input parameters.
Select calc.PAGE_NUMBER, and click OK.
You can use the Field tool to add any type of
field (query field, calculated field, input parameter) to a report. For information on the other built-in calculated fields, see
the Report Builder online Help.
Using layered controlsLayered controls are elements
that you place at the same location of a report band, and then use PrintWhen expressions
to conditionally display one or the other at run time. You can use
layered elements to customize the circumstances under which the
elements display and enhance a report’s ability to communicate important
information.
Place an element directly over another elementPlace the elements on the band.
Choose Window > Properties to display the Properties panel.
Specify
a PrintWhen expression, display properties, and
placement properties for each element using the Properties panel,
as follows:
Specify a PrintWhen expression for each
element. For example, you could specify the following expression
to display one element when shippeddate is later than requireddate
(that is, late) and another element when shippeddate is earlier
than requireddate:
- First element
- query.shippeddate LTE query.requireddate
- Second element
- query.shippeddate GT query.requireddate
Specify different display characteristics for each element.
For example, if an order is late, display it in red text.
Set the Top, Left, Height, and Width properties to the same
values for each element.
When you specify identical placement properties,
you access the individual elements through the Layered Controls
menu. Use the Layered Controls menuRight-click on the top element.
Select Layered Controls > elementname from the
pop-up menu. The Report Builder identifies each layered element
by displaying its PrintWhen expression.
Select the element and choose Window > Properties Inspector
to view the element properties.
Using linksYou
can include hypertext links from query fields, calculated fields,
input parameters, charts, and images to a variety of destinations:
An anchor or page within the same report
An anchor or page within another report
An HTML page, optionally specifying an anchor and URL parameters
One use for links is to create drill-down reports, in which you
click an item to display detailed information. For example, clicking
an employee line item passes the employee ID as a parameter to a
page that displays complete information for the employee.
For complete usage information on creating anchors and hypertext
links, see the Report Builder online Help.
Defining properties for report elementsA
set of properties defines every element on a report, including the
report itself. These properties affect the look, feel, and behavior
of each element.
For many properties, the Report Builder lets you define their
values through user interface elements, such as dialog boxes, toolbar
icons, and menu items. For example, you set a text label’s font
size using a toolbar icon. You can set values for all properties,
however, through the Properties panel, which display all properties
for the currently selected element.
Sometimes a report contains multiple, closely
spaced elements and it is difficult to select an individual element
using the mouse. In this case, selecting the element from the Properties
panel pop-up menu is an easy way to select an element. The Properties panel has two views:
- Sort alphabetically
- All properties for the currently selected element display
in alphabetical order.
- Sort into groups
- The Properties panel displays related properties in the following
predefined groups:
Advanced
Columns
Page Layout
Printing
Colors and Style
Data
Font
Font Style
Formatting
Hyperlinks
Layout
Print Control
The Report Builder displays
only groups that relate to the currently selected element.
Set or modify a property for an element in the workspaceSelect the element.
(Optional) If the Properties panel is not already displayed,
choose Window > Properties Inspector.
The Report Builder
displays its properties in the Properties panel.
Modify the property. Depending on the property, you enter
a value, select a value from a pop-up menu, or open the Expression
Builder to use an expression.
Press Enter.
When you select a color, double-click the color. Choose a different elementSelect the element from the pop-up menu. When you select
a new element, the Report Builder selects the element and displays
its properties.
Although the Properties panel is a powerful way
to set properties, you typically set properties through dialog boxes
and toolbar icons. For example, you use the Report Properties dialog
box to set report-wide settings. For complete information on setting
properties, see “Property reference” in the Report Builder online
Help. Displaying reportsYour application can
run a report by displaying the CFR file in a browser or by displaying
a CFM page whose cfreport tag runs the report.
You can optionally use the cfreport tag to save
the report to a file.
The cfreport tag supports advanced PDF encryption
options. For more information, see cfreport in the CFML Reference.
For information on report preview, see Previewing reports.
Display a report by using the cfreport tagCreate a report, with or without an internal query.
Create
a CFM page and add a cfreport tag that runs the
report. If the report does not use an internal query, also populate
a query and pass it using the query attribute.
If the report uses an internal query and you use the query attribute,
the passed query overrides the internal query.
<cfquery name="northwindemployees" datasource="localnorthwind">
    SELECT EmployeeID, LastName, FirstName, Title, City, Region, Country
    FROM Employees
    ORDER BY Country, City
</cfquery>

<CFREPORT format="PDF" template="EmpReport.cfr"
    query="#northwindemployees#"/>
Note: ColdFusion
does not render text that occurs before or after the cfreport tag.
Open a browser and display the CFM page.
ColdFusion
generates the report.
If you display an HTML report, ColdFusion generates
temporary files for images in the report. You can specify how long
the temporary files are saved on the server by using the resourceTimespan attribute
of the cfreport tag. For more information,
see the CFML Reference.Display a CFR file in a browserCreate a report that uses an internal
query and does not use input parameters.
Open
a browser and display the CFR file.
Save a report to a fileCreate
a report, with or without an internal query.
Create a CFM page and add a cfreport tag
that runs the report. Optionally pass a query attribute,
as described in the previous procedure. Include a filename attribute
that specifies the fully qualified name of the file being created,
as the following example shows:
<CFREPORT format="PDF" template="emppicture.cfr"
    filename="#GetDirectoryFromPath(GetTemplatePath())#/emppicture.pdf"
    overwrite="yes"/>
If you write
the report output to an HTML file, ColdFusion creates a directory located
relative to the HTML file, generates files for the images (including
charts) in the report, and stores the image files in the directory.
For more information, see Exporting the report in HTML. Use the .pdf
extension for PDF output format, the .swf extension for FlashPaper
output format, .xml extension for an XML file, .rtf extension for
an RTF file, .html extension for HTML files, and the .xls extension
for Excel format. Open a browser and display the CFM page. ColdFusion generates
the report, saves the file, and displays an empty page in the browser.
Disable browser display of the CFR fileOpen the Report Properties dialog box by selecting
Report > Report Properties from the menu bar.
Clear the Allow Direct .CFR Browser Invocation option, and
click OK.
Using input parameters to pass variables and other data at run timeInput parameters
are data fields that you pass to the report at run time. You can place
input parameters directly on a report band or you can use them as
input to a calculated field.
Define input parameters in the same manner as query fields. You
can specify a default value that ColdFusion uses when no corresponding
parameter exists. For more information on defining input parameters,
see Defining, modifying, and using fields and input parameters.
You use input parameters in the following ways:
Through the cfreportparam tag:
Input parameters must correspond, by name, to cfreportparam tags
embedded in the CFM page invocation. For example, if you define
an input parameter named ReportTime, you pass a cfreportparam tag
with a name attribute set to ReportTime, as the following example
shows:
<cfreport format="PDF" template="FourthReport.cfr" query="#coursedept#">
    <cfreportparam name="ReportTime" value="#DateFormat(Now())#, #TimeFormat(Now())#">
</cfreport>
Subreport parameters:
When a subreport requires information from a main report, you define
subreport parameters in the main report and corresponding input
parameters in the subreport. For more information, see Using subreports.
For information on dynamically populating input parameters at
run time, see Advanced query mode.
Using CFML in reportsCFML is the scripting language for
the Report Builder. By leveraging CFML, you can create reports that
select and format data to meet your needs. You use CFML in the following
areas of the Report Builder:
Advanced query mode
Report functions
Expressions
Advanced query modeIn some cases, you create
a complex query, reuse an existing query, or encapsulate additional
CFML processing as part of query creation for the report. To use a
query in these ways, you use advanced query mode to create CFML
that returns a query. When you click the Advanced button at the
top of the Query Builder, the Report Builder displays a text entry
area in which you can enter CFML that generates a query. ColdFusion
executes this tag at report execution time and passes the query
result set to the report.
Note: When you use advanced query mode, the Query
Builder does not create query fields automatically. create the associated
query fields manually.
The CFML used in advanced query mode must include a query object
whose name matches that in the Variable that contains the query
object field. You can use any CFML tag that returns a query object
or the QueryNew function. The CFML can use multiple
query objects, but can only return one.
Note: If
you set an empty variable (for example, <cfset name=" ">),
the Report Builder throws a Report data binding error.
This example CFML uses the cfhttp tag
to retrieve a query:
<cfhttp url="http://quote.yahoo.com/download/quotes.csv?Symbols=csco,jnpr&format=sc1l1&ext=.csv"
method="GET"
name="qStockItems"
columns="Symbol,Change,LastTradedPrice"
textqualifier=""""
delimiter=","
firstrowasheaders="no">
Another possible use of advanced query mode is to test for passed
parameters in the URL or FORM scopes and use those parameters to
retrieve data, as the following example shows:
<!--- First look for URL param. URL overrides cfreportparam. --->
<cfif isDefined("url.deptidin")>
    <cfset param.deptidin = url.deptidin>
</cfif>

<!-- Then look for FORM param. Overrides URL param. --->
<cfif isDefined("form.deptidin")>
    <cfset param.deptidin = form.deptidin>
</cfif>

<cfquery name="CFReportDataQuery" datasource="cfdocexamples">
SELECTLastName, FirstName, Dept_ID
FROMEmployee
WHERE (Dept_ID = #param.deptidin#)
</cfquery>
Using report functionsReport functions are user-defined
CFML functions that you code using the Report Function Editor and
run in report fields. You can use them to format data (such as concatenating
and formatting all the field that make up an address), to retrieve
data, and for many other purposes.
Three built-in functions are unique to Report Builder: InitializeReport, BeforeExport,
and FinalizeReport. For more information, see the Report
Builder online Help.
Report Builder built-in functionsSelect Report > Report Functions from the menu
bar.
The Report Function Editor displays.
Click the Add Default Functions icon (the first on the left).
The
built-in functions are added to the left pane.
Select a function from the left pane.
Commented code
associated with the function appears in the right pane.
Modify the code and click OK.
Create a report functionSelect Report > Report Functions from the menu
bar.
The Report Function Editor displays.
Click the plus sign to add a new report function.
The
Add Report Function dialog box displays.
Specify a name and click OK.
The Report Function Editor places a cfreturn tag
in the text entry area.
Code the function, and click OK. The function is a ColdFusion
user-defined function so all UDF rules and features are available
for use. The following example shows a report function that concatenates
address fields:
<cfargument name="Name" required="yes"/>
<cfargument name="Address1" required="yes"/>
<cfargument name="Address2" required="yes"/>
<cfargument name="City" required="yes"/>
<cfargument name="State" required="yes"/>
<cfargument name="Zip" required="yes"/>

<cfset variables.CRLF = Chr(13) & Chr(10)>
<cfset variables.ResultVar="">

<cfif Trim(arguments.Name) NEQ "">
    <cfset variables.ResultVar='#arguments.Name#'>
</cfif>
<cfif Trim(arguments.Address1) NEQ "">
    <cfif variables.ResultVar NEQ "">
        <cfset variables.ResultVar='#variables.ResultVar & variables.CRLF#'>
    </cfif>
    <cfset variables.ResultVar='#variables.ResultVar & arguments.Address1#'>
</cfif>
<cfif Trim(arguments.Address2) NEQ "">
    <cfif variables.ResultVar NEQ "">
        <cfset variables.ResultVar='#variables.ResultVar & variables.CRLF#'>
    </cfif>
    <cfset variables.ResultVar='#variables.ResultVar & arguments.Address2#'>
</cfif>
<cfif variables.ResultVar NEQ "">
    <cfset variables.ResultVar='#variables.ResultVar & variables.CRLF#'>
</cfif>

<cfset variables.ResultVar='#variables.ResultVar & arguments.City & ", " & arguments.State & " " & arguments.Zip#'>

<cfreturn variables.ResultVar>
Use a report functionPlace a dynamic field on the appropriate report
band.
The Add Field dialog box displays.
Specify Manually Entered Expression, and click OK.
The
Expression Builder displays.
Specify "report.functionname", and click OK.
Using expressionsMany elements of the Report
Builder (including query fields, calculated fields, input parameters,
images, and report object attributes) are single operand ColdFusion
expressions. Because these elements are expressions, you can manipulate
them with CFML functions.
The Expression Builder is a graphical interface that lets you
quickly apply CFML functions to Report Builder elements. Uses for
the Expression Builder include the following:
Many of the report object attributes (such as PrintWhen)
accept expressions, which you can associate with query parameters,
input parameters, or ColdFusion page variables. You can tie report
attributes and columns to display based on run-time data or user
preference.
Concatenating fields
Formatting fields
Calculated fields
Accessing and displaying ColdFusion page variables and scopes
For information on using the Expression Builder, see Report Builder
online Help.
For more information on expressions, see Using Expressions and Number Signs.
Using chartsCharts can help clarify large or complex
data sets. The Report Builder lets you place a chart in any report
band and supports many types of charts.
To
add a chart to a report, you use the Chart Wizard, which steps you
through the chart building process. The Chart Wizard, which is fully
integrated with the Query Wizard to facilitate database-driven charts,
helps you define the chart type, the data used for the report and
other formatting options.
As you use the Chart Wizard to choose and define
the various aspects of a given chart, the Report Builder uses RDS
to generate chart images in real time. However, the data in these
chart images is not real. The Chart Wizard includes the following panels:
Chart Types: Select the chart type (for example,
bar) and subtype (for example, 3D-stacked).
Chart Series: Select the data for the series. When
you add a series, the Report Builder lets you hard-code series data
or open the Query Builder to populate the series using a database
query.
Chart Formatting: Specifies title and series, general
appearance, 3D appearance, lines and markers, and font.
The data you specify through the Chart Wizard
corresponds to the attributes specified in the cfchart, cfchartseries, and cfchartdata tags. For more information
on these tags, see the CFML Reference.For complete information on ColdFusion charting capabilities,
see Creating Charts and Graphs. For more information on charting using the Report
Builder, see Report Builder online Help.
Using subreportsSubreports
let you nest a report within your report. The data that you display
in a subreport is typically related to the data in the main report.
You enable this display by passing one or more subreport parameters
to the subreport. However, the data displayed in a subreport can
also be unrelated to the data in the main report.
Reasons to use subreports including the following:
You prefer to avoid complex SQL, such as a RIGHT OUTER
JOIN.
Your report requires data from multiple databases.
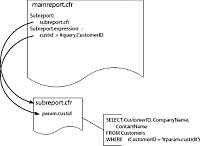
The following example shows the use of subreport parameters and
the relationship between a report and a subreport:
Note: Although the Report Builder supports multiple
levels of nesting, it displays one level of nesting only.
For additional information on subreports, see the Report Builder
online Help.
Defining a subreportYou
can define a subreport and include it in a report, or you can define
it as part of inserting the subreport in the main report.
A subreport has the following characteristics:
Data displayed in the detail band only. A subreport uses
no header or footer bands.
If the subreport is related to the main report, it must include
an internal query that uses a SELECT statement with a WHERE clause
specifying the name of the input parameter used in the main report’s
Subreport Expression property.
If
you have already defined a subreport, you add it to the main report
and define subreport parameters, as necessary.
Add an existing subreportDefine or open your main report.
Click the Subreport icon in the toolbox.
Drag an area for the subreport in the desired report band.
Select From An Existing Report, specify the subreport, and
click Next.
Select the fields in the main report that correspond to fields
in the subreport and click Next.
Click Finish.
The Report Builder adds the subreport
to the main report, saving the report to subreport mappings as subreport
parameters.
To modify subreport parameter settings, select the subreport
and click Subreport Parameters in the Properties panel.
If you
are certain about the data required for a subreport, you can define
a new subreport while adding it to the main report.
Add a new subreportDefine or open your main report.
Click the Subreport icon in the toolbox.
Drag an area for the subreport in the report band.
Select As A New Report and click Next.
Click Query Builder.
Select the tables and columns for the subreport.
Specify a WHERE clause for the report by using the Condition
and Criteria columns for the key columns.
Specify a WHERE
for Condition and either ='#CFVariable#' (string column)
or =#CFVariable# (numeric column) for Criteria,
and then overtype CFVariable with the name of the
input parameter for the subreport (you define the input parameter
name later in the procedure.)
Click Save, and then click Next.
Specify grouping fields, if appropriate for your subreport,
and click Next.
Specify Free Form or Grid, and click Next.
Specify Only Detail Band, and click Next.
Specify a color scheme, and click Next.
Specify headings, as appropriate, and click Next.
For each parameter required by the subreport, specify the
following:
Click Next.
Specify a fully qualified filename for the subreport, and
then click Next.
Click Finish.
Report Builder adds the subreport to
the main report. Report Builder lets you change subreport name and
modify subreport parameters in a main report.
Modify subreport settingsClick
the subreport element in the main report.
To change the subreport, modify Subreport Expression.
To modify subreport parameters:
Click the Subreport
Parameters property.
Click the ... button.
Add, modify, or delete subreport parameters, and click OK.
|