|
ColdFusion 9.0 Resources |
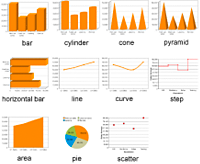
About chartsThe ability to display data in a chart or graph can make data interpretation much easier. Rather than present a simple table of numeric data, you can display a bar, pie, line, or other applicable type of chart using colors, captions, and a two-dimensional or three-dimensional representation of your data. The cfchart tag, along with the cfchartseries and cfchartdata tags, provide many different chart types. The attributes to these tags let you customize your chart appearance. You can create 11 types of charts in Adobe ColdFusion in two and three dimensions. The following figure shows a sample of each type of chart. Note: In two dimensions, bar and cylinder charts appear
the same, as do cone and pyramid charts.
|